The use of a rectangular window requires that the measurement window is synchronized with the actual power system frequency, hence the use of a 10-cycle window instead of a window of exactly 200 ms. The IEC standard [1] requires that 10 cycles correspond with an integer number of samples within 0.03%. To ensure synchronism between the measurement window and the power system frequency, most power quality meters use a phase-locked loop generating a sampling frequency that is an integer multiple of the actual power system frequency. One of the commonly used in the company power quality meters is Elspec G4500 which provides full functionality regarding measurements of power quality. An exemplary connection of such measurement equipment in there phase system is presented in Figure 1 [2].
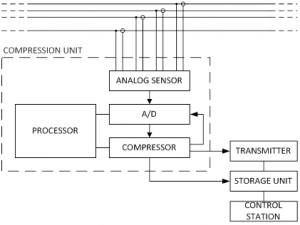
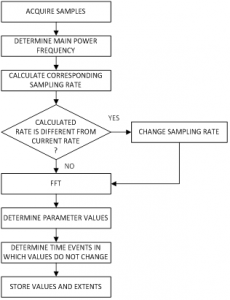
Before power quality indices are calculated by the Elspec equipment, acquired data is processed. Processing stage comprises of fundamental frequency detection, sample rate adjustment according to the detected frequency, and Fourier decomposition applied. The approach of sample rate adjustment is to adjust the finite orthogonal Hilbert basis in order to express each of frequency components in the Fourier space only by one vector from the Hilbert basis. The whole data acquisition, processing and logging process is briefly presented in Figure 2.
A synchronization (i.e. sample rate adjustment according to the fundamental frequency) error leads to cross-talk between different harmonic frequencies. The 50 hz component is by far the dominating component in most cases so that the main concern is the cross-talk from the 50 hz component to higher order components. From the other side, resampling process can affect frequency components which are not integer multiple of the fundamental frequency.
This phenomenon can be easily seen in the spectrum of pulse width modulated voltage source converters with fixed frequency ratio. Since generated output voltage of the wind turbine is a function of the fundamental frequency (fo) and the carrier frequency (fc), results obtained by the Elspec system are incorrect to some extent. The magnitudes of Fourier transform harmonic components are the more inaccurate the higher significant is the fundamental variation. Even if the result of applying the discrete Fourier transform to the basic window is a spectrum with 5-hz spacing between frequency components and the spectrum thus contains both harmonics and interharmonics, the results can be sometimes significantly inaccurate.
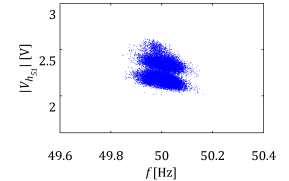
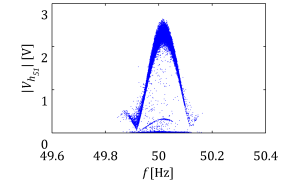
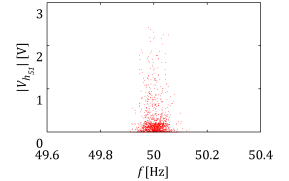
As a good example of this is one of the most significant sideband harmonic components from the first carrier group. Exemplary results of measurements form the LV side of the wind turbine transformer can be seen in Figure 3. As it was mentioned previously the wind turbine frequency ratio is mf=49 and the analyzed sideband harmonic component is of frequency fc+2fo. Three scatter plots present the same harmonic component measured during the same period using different data acquisition devices and processing techniques.
 |
 |
| (a) | (b) |
 |
|
| (c) | |
Figure 3 Sideband harmonic component affected by different processing techniques: (a) sideband harmonic calculated in post-processing from resampled signal, (b) sideband harmonic calculated in post-processing from original signal, (c) sideband harmonic calculated on-line by power quality meter.
Data processing results presented in Figure 3 show how easily inappropriately applied processing techniques can provide wrong results. Results from Figure 3(a) show sideband harmonic component measured using results obtained from the measurement campaign with direct Fourier decomposition (i.e. without sample rate adjustment). From Figure 3(b) presents the same data but resampled and later discrete Fourier transform is applied, Figure 3(c) describe sideband harmonic component magnitude obtained by the Elspec measurement system.
It can be observed that results using various processing approach provide different results. Due to the fact that the frequency of sideband harmonic components generated by modulation with constant carrier frequency does not vary significantly and Fourier decomposition without earlier sample rate adjustment gives the most appropriate results. This is presented in Figure 3(a) and only small magnitude variation affected by nonlinear relation between the modulation index () and the sideband harmonic components as well as measurement and data processing (i.e. small spectral leakage) errors. Completely different and unacceptable results are seen in Figure 3(b) where analysed waveform is resampled. One can observe that due to significant spectral leakage the estimated magnitude sometimes can be even equal to zero. Therefore sometimes power quality meters can provide values significantly affected by processing errors. This behaviour is present in the scatter plot from Elspec measurements (Figure 3(c)). It is important to emphasize that the algorithm in the power quality meter applies lossy compression which also determines estimated magnitudes. Estimated harmonic components are assumed to be insignificant and not saved (i.e. set to zero) if the magnitude is lower than a certain threshold which is defined based on measured waveform distortion and maximum allowed database storage capacity per month. Such limitations provides scatter plots as in Figure 3(c) which is similar to Figure 3(b) but modified due to averaging and magnitudes below the threshold artificially set to zero.
[1] "Electromagnetic compatibility (EMC) - Part 4-30: Testing and measurement techniques - Power quality measurement methods," International Electrotechnical Commission Standard IEC 61000-4-30, 2008.
[2] P. Nisenblat, A. M. Broshi, and O. Efrati, "Methods of compressing values of a monitored electrical power signal," U.S. Patent 7,415,370 B2, Aug. 19, 2008.
